California Mathematics Council North Conference at Asilomar
If a picture is worth 1000 words, what is GeoGebra worth?
A collection of dynamic mathematics demonstrations built around the claim that interaction can communicate more than a static diagram.
Context
A compact conference resource page with a handout, slides, HTML applets, and GeoGebra source files.
The original Word-generated HTML remains available for historical reference. This page is the main entry point.
The talk moved across geometry, algebra, trigonometry, and calculus. Its common thread was not a particular topic but a way of using dynamic diagrams: give learners something they can move, then let the mathematical structure answer back.
The applets are presented together because they were originally assembled as one conference argument rather than as nine unrelated files.
Interactive materials
Applets from the talk
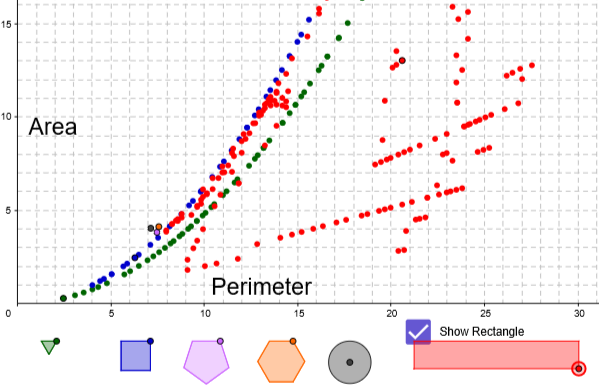
Area vs. Perimeter
Investigate which area and perimeter combinations are possible for rectangles, adapted from a Malcolm Swan prompt.
Open applet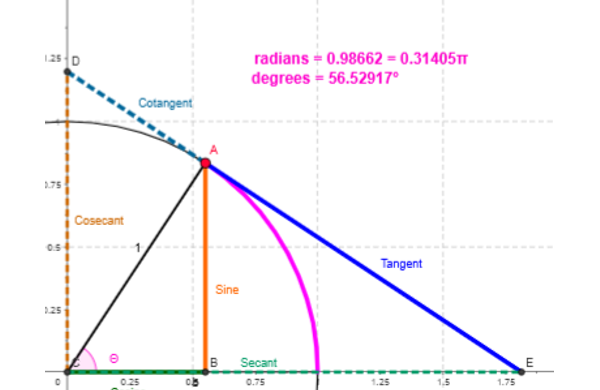
Unit Circle Trigonometry
Connect a rotating point on the unit circle to trigonometric values and their geometry.
Open applet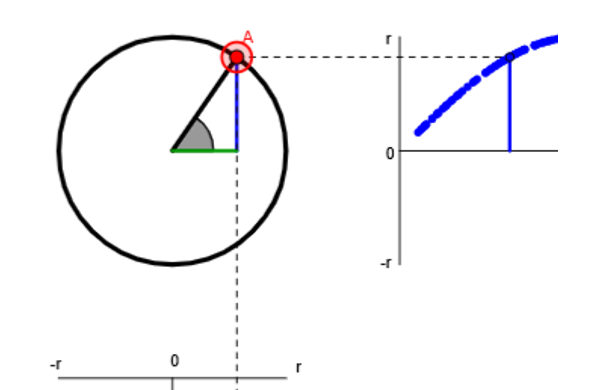
Generating Sine and Cosine from the Circle
Use circular motion as a live generator for sine and cosine waves.
Open applet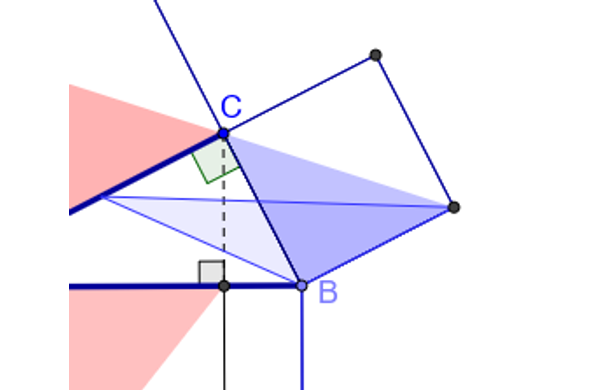
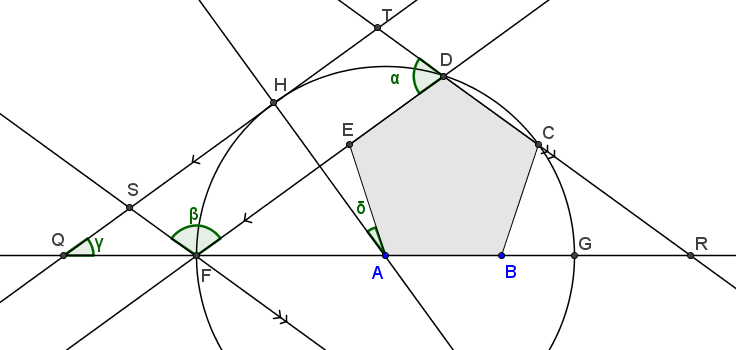
Euclid's Pythagorean Proof
Step through a visual proof of the Pythagorean theorem and the geometric moves behind the result.
Open applet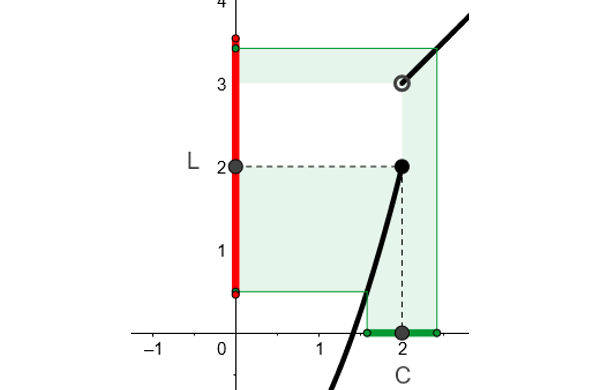
Epsilon and Delta Limits
Manipulate epsilon and delta intervals so the formal limit definition has a dynamic picture.
Open applet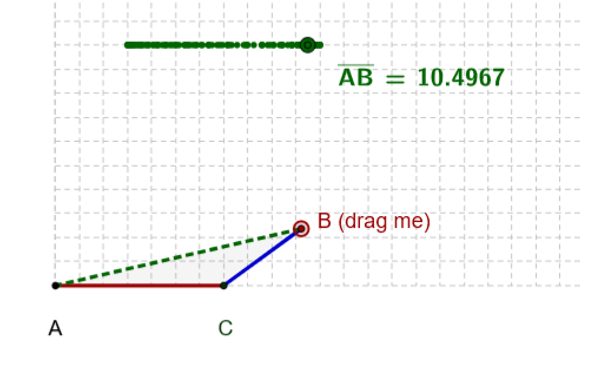
Triangle Inequality Drag
Drag segment lengths and watch possible triangles appear, disappear, or collapse at the boundary.
Open applet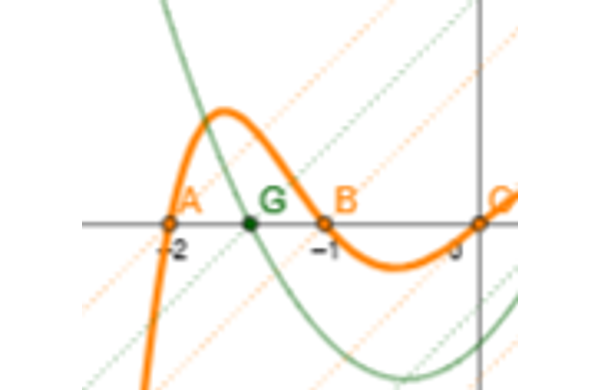
Painting with Linear Factors
Use factors as visible controls for shaping a graph, adapted from Riley Lark's activity idea.
Open applet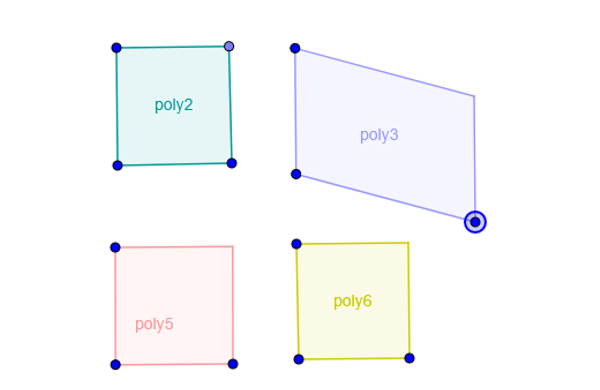
Square Not Square
Compare what stays square, what only looks square, and what changes under dragging.
Open applet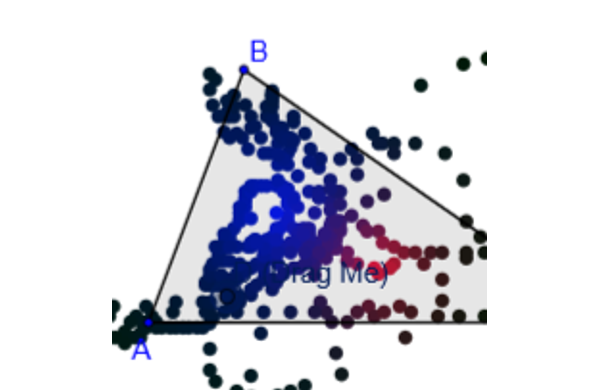
Distances to Vertices
Explore how distances from a movable point to triangle vertices change and what patterns emerge.
Open appletRelated writing